Outcome View report
Overview
The Outcome View report enables you as a Function Manager, to use Outcome related KPIs (Key Performance Indicators) to evaluate various key metrics which contribute towards the whole Outcome. These key metrics include data such as how long Workgroups spend working on the Tasks and Task Groups that contribute to the Outcome. You can drill-down into each Outcome/Task Group to gain deeper insights for the completed Tasks and Outcomes.
To utilise this report your organisation will need to have completed the administration activities related to creating Outcomes.

Workgroup
Outcome / Task Group
Duration Start Date / End DateThe Outcome View report displays data by month. Select the last month of data you would like to report on by clicking on the calendar icon View Report
|
The tiles at the top of the report give you a summary view of the Outcome you have selected to run the report for across all the chosen workgroups.
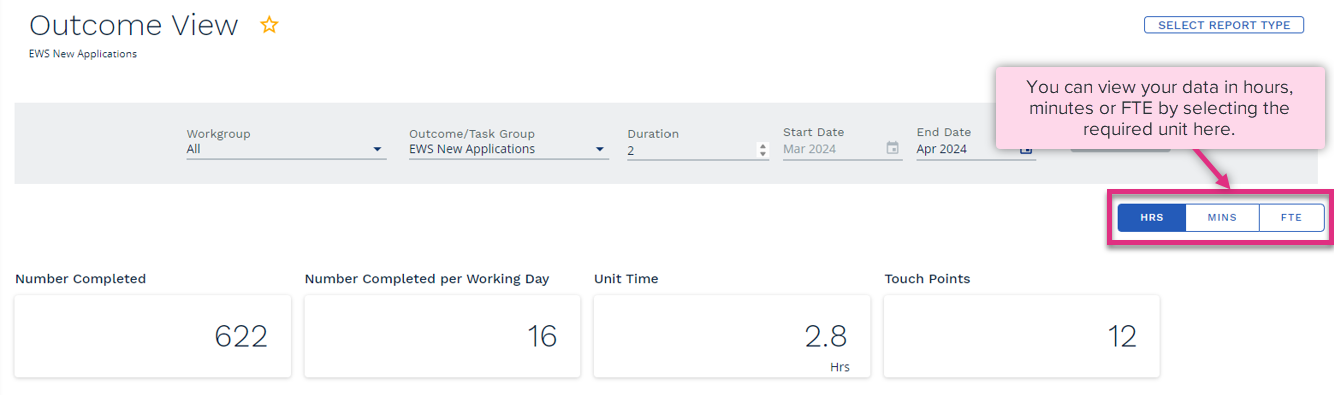
Number Completed
Number Completed by Working Day
Unit Time
Touch Points
|
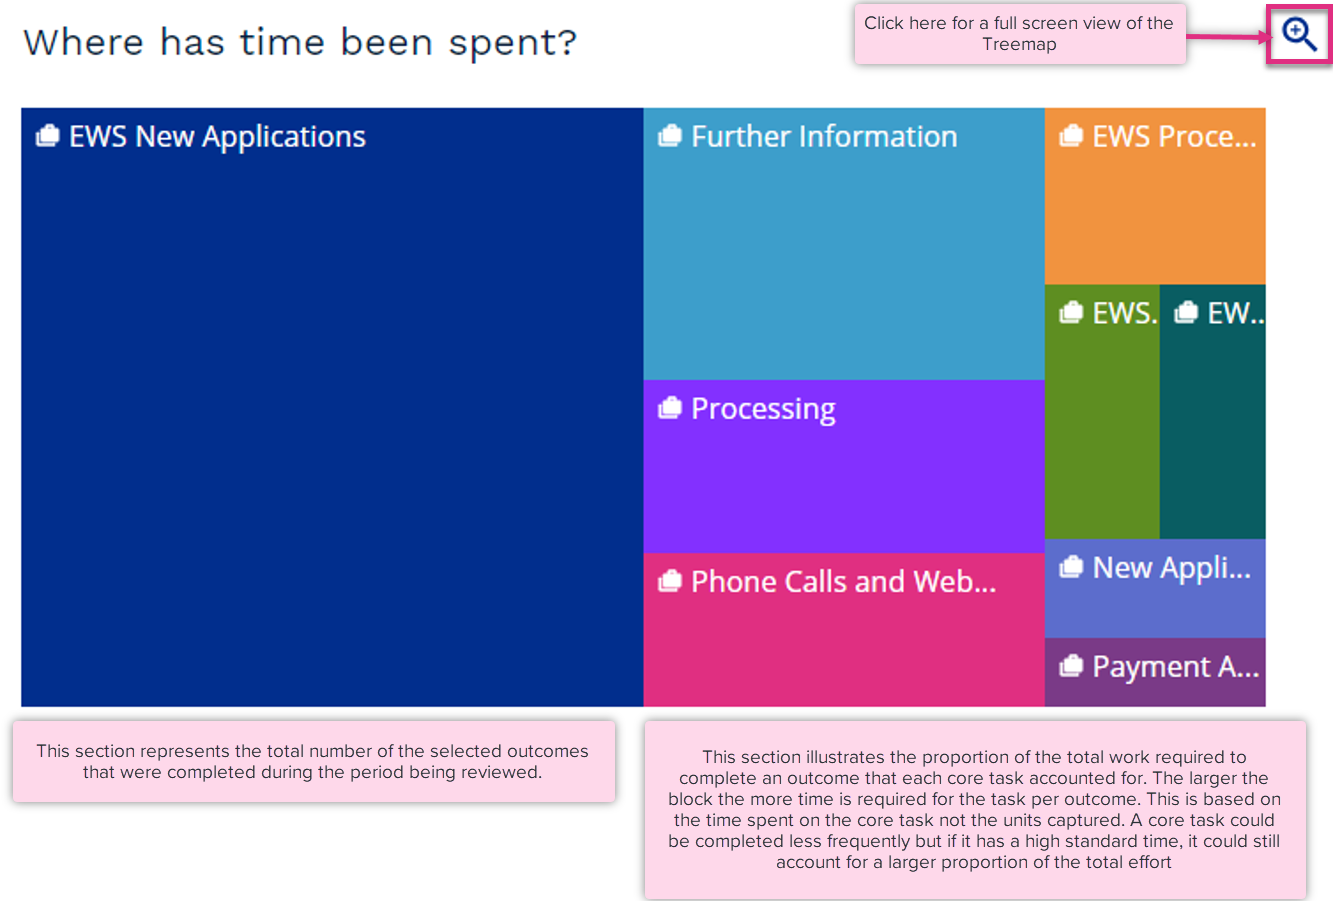
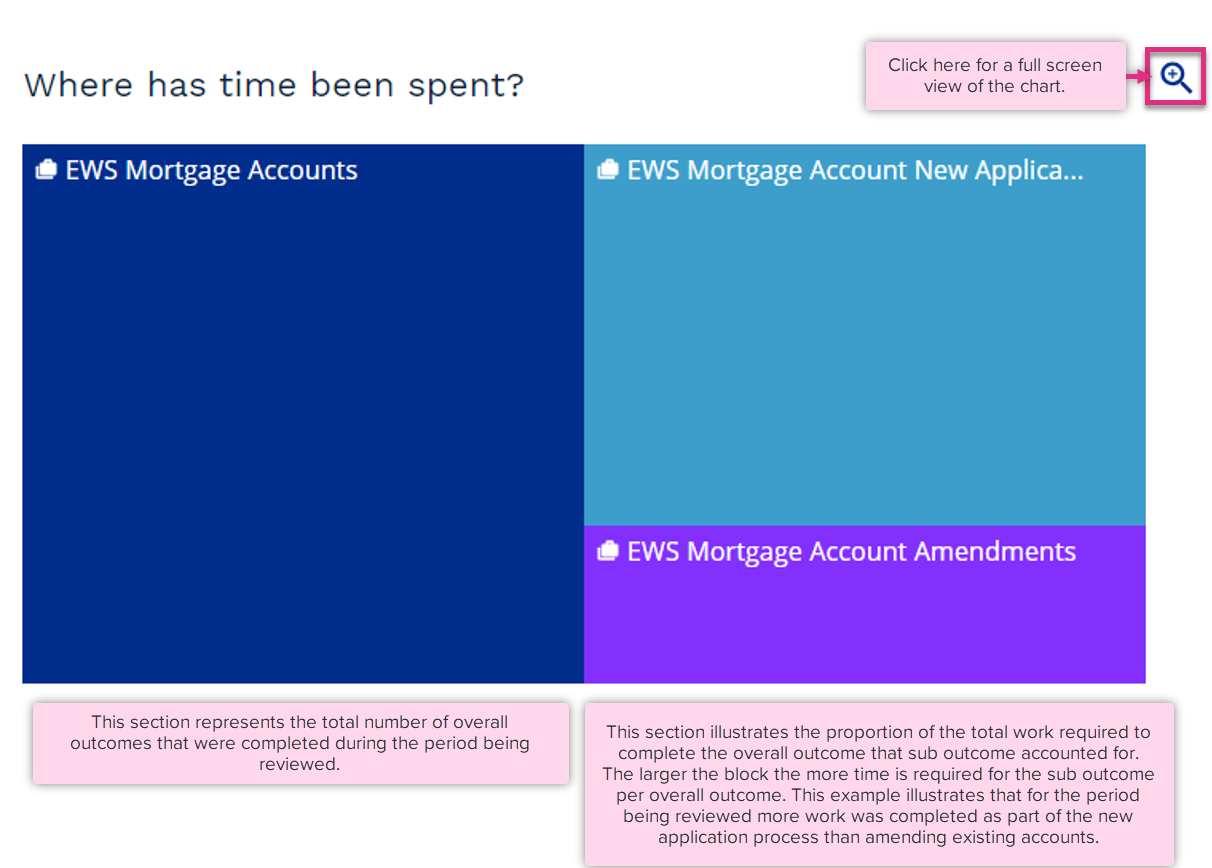
The Where has time been spent section illustrates the proportion of total work required to complete an outcome that each core task accounts for in a Treemap.
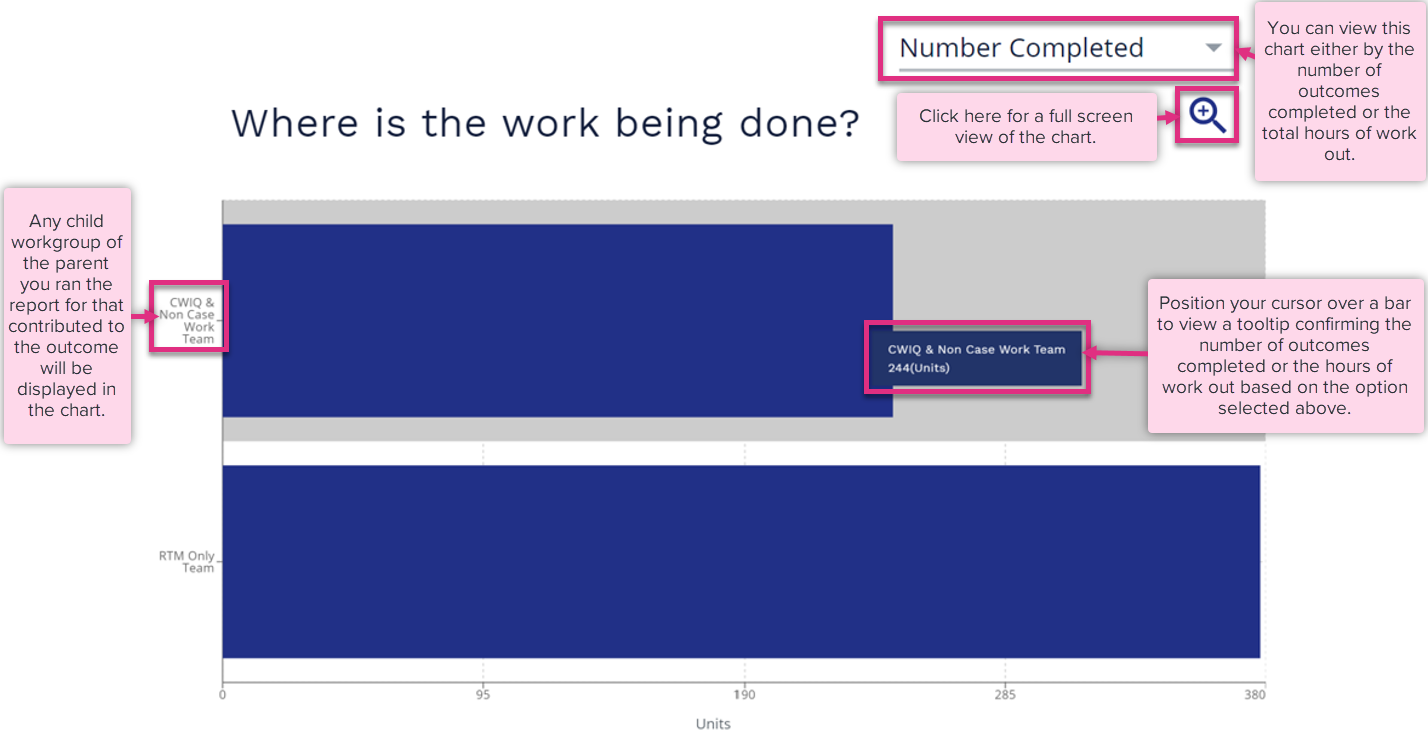
The where is work being done section allows you to review the total number of outcomes each workgroup contributed as well as the total hours of work out that were required to complete the outcomes.
The outcomes details table provides a of the effort required to complete an outcome in time and touches for each core task.
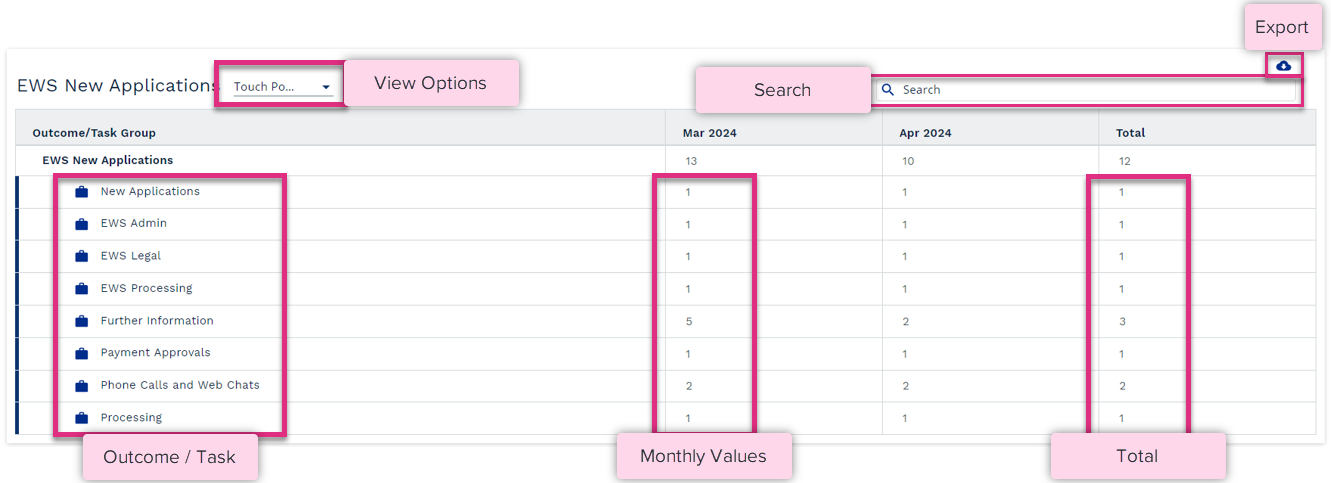
View Options
Search
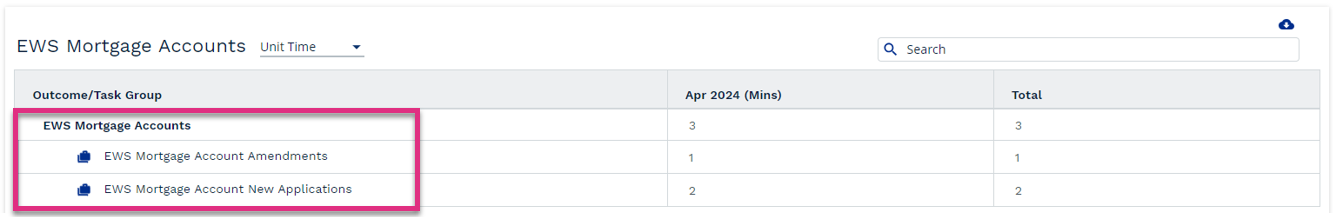
ExportClick here to export the details data to Excel. Outcome / Task Group
Monthly Values
Total
|
In this example EWS Mortgage Accounts is the overall outcome and beneath that there are 2 sub outcomes EWS Mortgage Accounts New Applications and EWS Mortgage Account Amendments. This represents a single outcome of managing the mortgage accounts that is fed by 2 processes, creating new accounts, and amending existing ones.
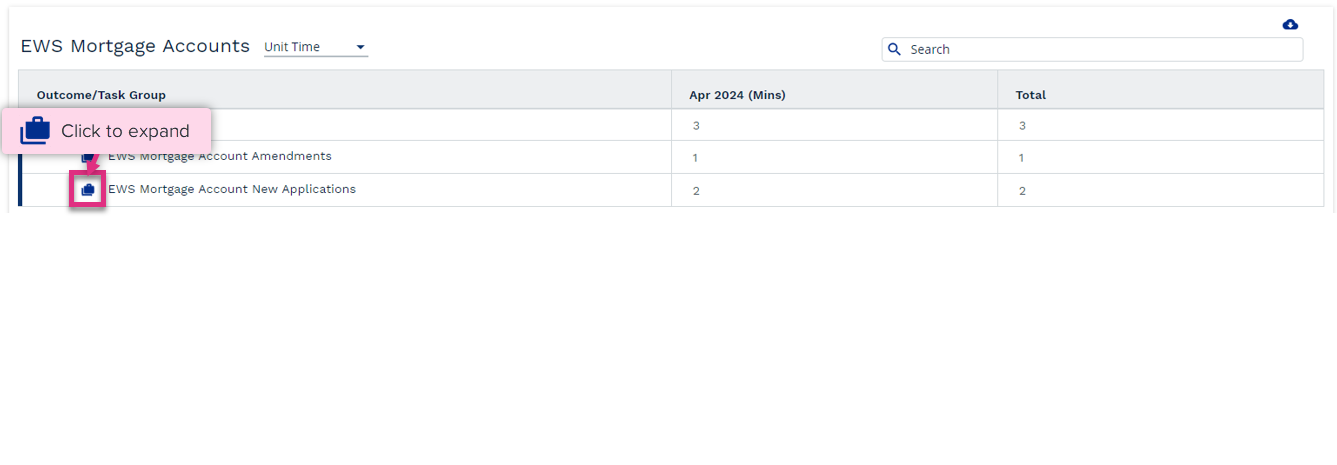
At the highest level the Outcome Details table will display the outcome data at an overall outcome and then sub outcome level.
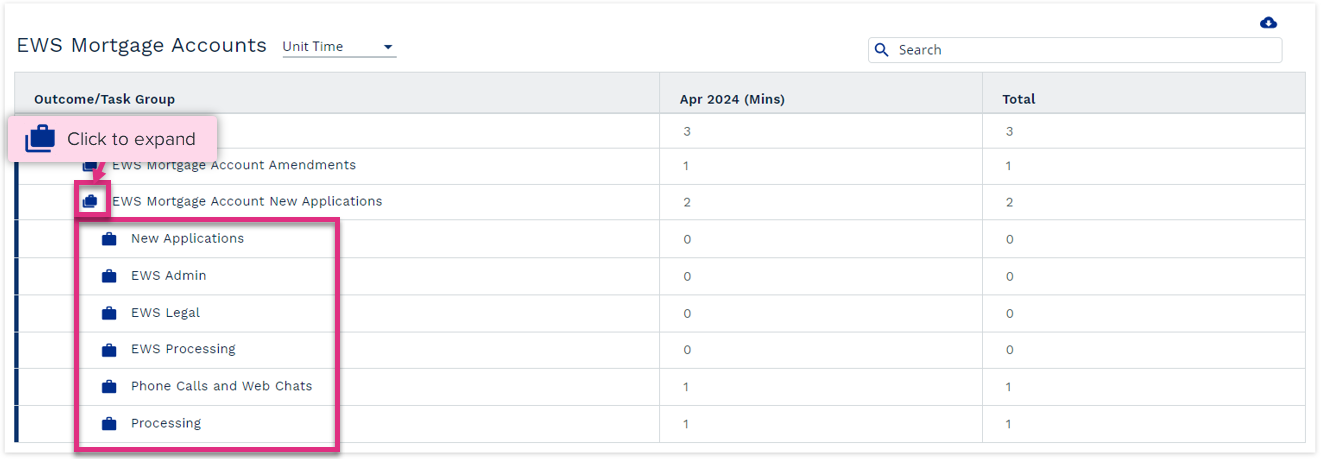
You can expand this information to view core task level data by clicking on the ![]() icon next to each sub outcome.
icon next to each sub outcome.
|
| For more information on... | |
|---|---|
|
Calculations |
See Key Equations |
| Frequently Asked Questions | See FAQs |


